What is Microsoft Power BI? Benefits, Features, and Uses

In today’s data-driven world, companies need the ability to extract precise insights from vast amounts of information. Microsoft Power BI bridges business intelligence and data visualization, enabling organizations to make fast, effective decisions. Its connectivity to multiple data sources, interactive dashboards, and real-time analytics make it a preferred tool for companies of all sizes.
Whether you are a small business owner seeking better insights into operations or a large enterprise managing massive volumes of data, Power BI offers a flexible, scalable, and user-friendly solution. Its integration with other Microsoft tools, AI capabilities, and customizable features forms a powerful trio that enhances efficiency and boosts productivity. In this article, we explore Power BI’s key advantages, core features, and practical applications. You will also learn how to work with and leverage this tool, supported by Power Platform Consulting Services and client consulting services to guide you along the way.
Table of Contents
What is Microsoft Power BI?
Microsoft Power BI is a business analytics service that converts raw data into meaningful and interactive visual insights. Users use Power BI to connect various data sources, create compelling reports and dashboards with visual analytics, and share those insights among themselves within the organization to facilitate better decision-making. Power BI provides tools for data preparation, visualization, and publishing existing visualizations, ranging from free tools for individuals to high-cost enterprise services for big organizations.
What are the Benefits of Power BI?
Microsoft Power BI offers simpler reporting. The combination of interactive visualizations, AI analytics, and collaboration options makes it a platform where raw data is converted into informed decisions. With that flexibility, it becomes an essential tool for any business that wants better decision-making, team collaboration, and support for a data-driven culture.
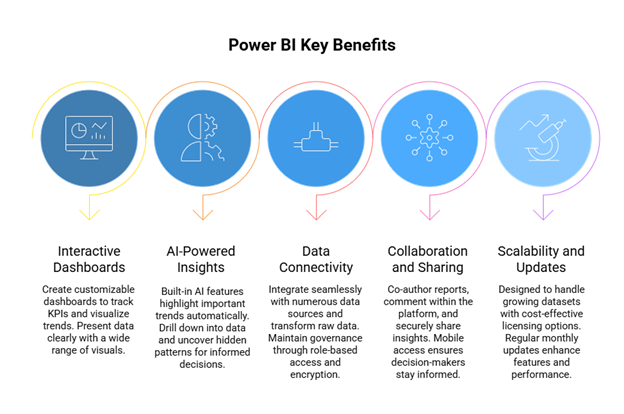
Interactive Dashboards
Possibly one of the most beneficial features of Power BI is designing interactive, dynamic dashboards. These dashboards help users track KPIs, visualize performance trends, and monitor set KPIs in real-time, with responses to changes. Custom layouts define the information rendered to stakeholders based on what is most pertinent to them; thus, much faster and better decision-making can take place.
Rich Visualizations
An extensive collection of visuals in Power BI lets one choose something from simple bar and line charts to complex maps and even custom visuals. This helps tell stories out of dense data sets, making the stories easy to grasp. Users select the visual that best conveys the data at hand so that there is crystal-clear transparency and engagement for all.
Data Exploration
In Microsoft Power BI, the user is provided with interactivity beyond static reports by drilling into data points, filtering content, or looking deeper into trends. Exploring the business environment interactively enables one to uncover hidden patterns, identify anomalies, and discern possible causes of problems, resulting in better decision-making based on data.
AI-Powered Insights
AI integration is one great feature of Power BI. Things like key influencer analysis and anomaly detection can highlight changes in data sets automatically, surface trends, forecast possible outcomes, etc. This provides value by allowing an organization to identify opportunities and risks without requiring advanced data science skills.
Various Data Sources
Microsoft Power BI can easily link to multiple data sources such as Azure Data Lake, Salesforce, SQL Server, Google Analytics, and Excel files. Thus, it removes data silos and ensures that all information, whether it’s stored in the cloud or on-premises, is available to one consolidated platform for analysis.
Data Governance
Maintaining data integrity is critical. Power BI takes care of the matter by providing strong governance. Role-based access controls ensure that data is encrypted and complies with various industry standards. Administrators can set permissions such that only authorized users can view and edit certain datasets and reports.
Data Transformation
Built within Microsoft Power BI, Power Query allows anyone to clean, transform, and shape raw data into the best analysis-ready format. Reports and dashboards must be built on accurate, consistent, and quality data. This is important so that trust remains in the delivered insights.
Scalability
With time, the growth in the operations of an organization depends on the growth of its data volume. Power BI is designed to work on big datasets without compromising performance. Regardless of whether it is a small startup or a large enterprise, this platform will cater to all scaling needs.
Easy Sharing
Internal and external sharing of dashboards and reports is simple with Microsoft Power BI. Users can publish to the web, integrate analytics into PowerPoint or Teams, or send stakeholders secure links. This way, insights will be available to the right people on time.
Real-Time Collaboration
Collaboration is at the heart of Power BI. Teams can co-author reports on the fly, comment on findings directly inside the platform, and make data-driven decisions together in real time, which allows higher alignment and faster informed decisions across departments.
Mobile Access
Power BI Mobile gives decision-makers the ‘anytime, anywhere’ privilege to access insights. Mobile-optimized reports and dashboards keep the team informed while on the go, working remotely, or traveling, so they respond fast to new opportunities or challenges.
Cost-Effectiveness
Compared to other BI platforms, Microsoft Power BI can maintain advanced specifications while being reasonably priced. There are inexpensive licensing options offered for businesses to start with, grow at their own pace, following which they can utilize the full suite with which it is associated.
Regular Updates
There has been a monthly improvement for Microsoft Power BI offered by Microsoft with continued updates so that users will never be left behind in data analytics: the advent of new features, bug fixes, performance optimization, and integration improvements.
Seamless Integration
By way of example, Power BI integrates smoothly with other applications such as Excel, Teams, and SharePoint. In that way, organizations and companies can combine analytics into their existing workflows, thus improving productivity and making data insights a part of the daily routine in operations.
Unlock Data Insights with Power BI
What are the Features of Power BI?
These features really make Power BI from Microsoft one of the most potent tools for data analysis and visualization. From capable data connections to AI-based insights, it lends businesses the power to explore, understand, and disseminate information into actionable insights for smart decisions, teams, and departments.
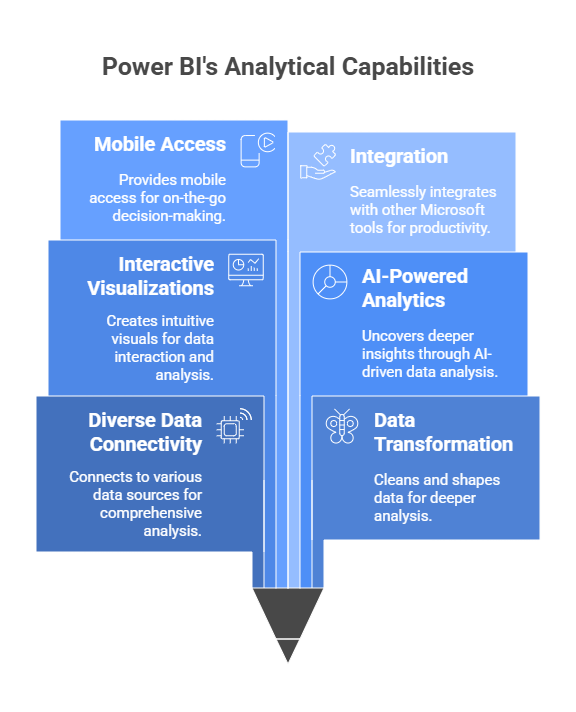
Diverse Data Connectivity
Microsoft Power BI’s ability to connect to a wide range of data sources stands out among its many features. Whether retrieving information from databases, spreadsheets, cloud platforms, or even social media, the platform sees to it that all relevant data comes together for the actual analysis. This prevents the creation of any data silos, enabling an end-to-end view of the business.
For data transformation comes Power Query
In Power BI, Power Query facilitates and cleans up data from various sources, making it easier to do ETL processes. A user can clean and shape the data, merge two or more data sources, and prepare it for deeper analysis without a deep understanding of coding. Clean and well-structured data, therefore, becomes the basis for analysis.
Data Modeling Capabilities
With Power BI, users can create stronger data models along with linking the data from multiple tables. Subsequently, complex analysis, such as linking financial, sales, and customer data into one reporting framework, is offered to make the insights much more comprehensive and actionable.
Interactive Visualizations
Microsoft Power BI presents strengths in visualizations. Users may craft charts, graphs, maps, and other visuals to interact and analyze data intuitively. These visuals create great stories so that data can be easily perceived and can activate users to interrogate and analyze information from various perspectives.
Custom Visualizations
In case a company has an unusual need, Power BI allows the use of custom visuals built in R or Python. This gives a bit of extra flexibility to the platform beyond what is offered in the default visual library and allows for highly specialized and creative ways to communicate data for unusual use cases.
Advanced Report Building
Reports in Power BI can combine multiple visuals with interactive filters and drill-down capabilities for deeper exploration. This allows users to view both a high-level summary and a detailed view within a single report.
Workspaces for Collaboration
With the workspaces feature in Microsoft Power BI, teams can collaborate on building, editing, and reviewing reports and dashboards. Access can be granted to specific groups, ensuring that reports are developed collaboratively while maintaining control.
Apps for Easy Distribution
Dashboards and reports can be packaged as apps in Power BI, making distribution to various teams or departments nearly negligible. The delivery of content is smooth, and stakeholders receive only curated and pertinent insights.
Sharing and Embedding Options
Microsoft Power BI allows many ways to share, whether through sharing a secure link, embedding visuals into a SharePoint page or Microsoft Teams, or publishing a report to the web. These sharing mechanisms broaden the audience for insights both inside and outside the organization.
AI-Powered Analytics
Anomaly detection, sentiment analysis, and tight machine learning integration: these AI features within Power BI uncover deeper insights from harder-to-mine datasets. In addition, the Q&A mechanism allows users to ask questions in natural language and get visual answers instantly.
Mobile Access
The Microsoft Power BI mobile application supports iOS, Android, and Windows devices so that users may view dashboards and reports anywhere. The mobile-friendly design keeps the insights within reach for decision-making while on the go.
Automatic Data Refresh
In Microsoft Power BI, users can schedule their data refreshes to always keep the reports displaying the latest information. This, however, obviates manual updates and keeps the insights current.
Integration Above Others
Most importantly, Power BI from Microsoft fits perfectly with tools such as Excel, Teams, and SharePoint in a highly performant manner. This allows a user to embed reports in their daily workflow, collaborate efficiently, and derive maximum productivity without juggling across multiple platforms.
How Does Power BI Work?
Power BI is Microsoft’s popular Business Intelligence (BI) tool that assists organizations in displaying data, analyzing it, and sharing it in useful ways. It connects various kinds of data sources and transforms them into raw materials while making interactive dashboards that provide insight to businesses necessary for correct decision-making. The two strong components Power BI caters to are Power BI Desktop, which is used for report designing, and Power BI Services, which is used for sharing and collaboration.
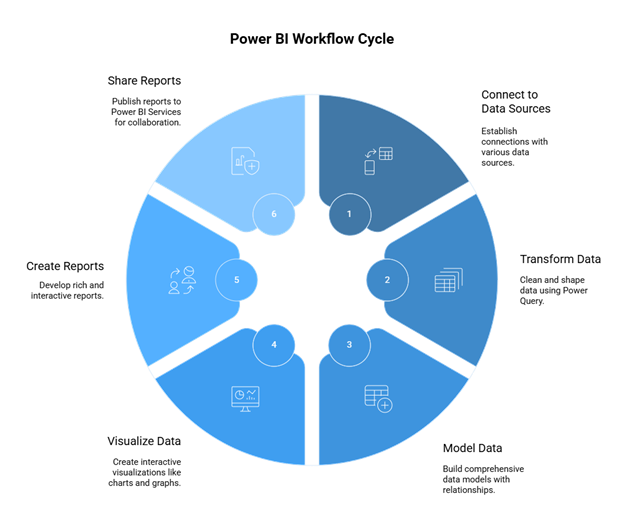
Data Connection and Transformation
Power BI Desktop provides strong data connectivity, including Excel spreadsheets, SQL databases, by cloud, and on-premises services. The Power Query editor allows users to clean, shape, and transform data with ease; users do so while making sure the data is in ‘analysis-ready form, which eases working with harder datasets without having to code deeply.
Data Modeling and Visualization
Once the data is prepared, users can combine multiple sources to build comprehensive data models with defined relationships. Power BI offers many ways to visualize data through charts, graphs, maps, and others, thereby presenting data in a lucid, interactive manner. Users can apply filters, customize visuals, and build engaging reports that showcase trends and KPIs.
Report Creation and Sharing
With Power BI Desktop, organizations can create rich and interactive reports that meet business needs and then publish those reports to Power BI Services for secure sharing and collaboration in the cloud. The service allows the creation of workspaces, granting access to users, and publishing of applications so as to control the visibility of reports. Reports can also be embedded elsewhere within other applications, integrated within Microsoft Teams, or accessed from mobile phones, allowing users to make fast decisions while on the move.
How to Use Power BI Effectively?
| Key Focus Area | Best Practices & Tips |
| Data Connection & Preparation | – Connect to multiple data sources such as Excel, databases, or cloud services. – Use Power Query Editor to cleanse and transform the data, such as handling missing values, changing data types, or creating calculated columns. – Build a star schema for optimal performance and create relationships between tables. – Use DAX (Data Analysis Expressions) to create some advanced calculations and measures. |
| Visualizations & Reports | Choose charts and graphs best capable of conveying your insights. – Create interactive dashboards with clear navigation. – Use tooltips and report page tooltips to impart extra context. – Design to suit the audience’s requirements and data literacy. – Improve performance by reducing visuals, optimizing queries, and utilizing efficient data types. |
| Sharing & Collaboration | – Publish to Power BI services for easy access – Implement row-level security (RLS) to protect sensitive data – Embed reports into platforms like SharePoint or websites – Share .pbix files for collaboration and further development |
| Learning & Practice | – Begin with a real-world project and a defined set of questions that need answers – Use theoretical material available at Microsoft Learn and on YouTube – Keep working on it, trying out different datasets, different features |
What is Power BI Used For?
Without a strategic plan for how to use it, Power BI will not be able to create anything more than basic reports. Properly adhering to a set of best practices will ensure that the Power BI environment works up to its full potential for data-driven decision-making and business growth.
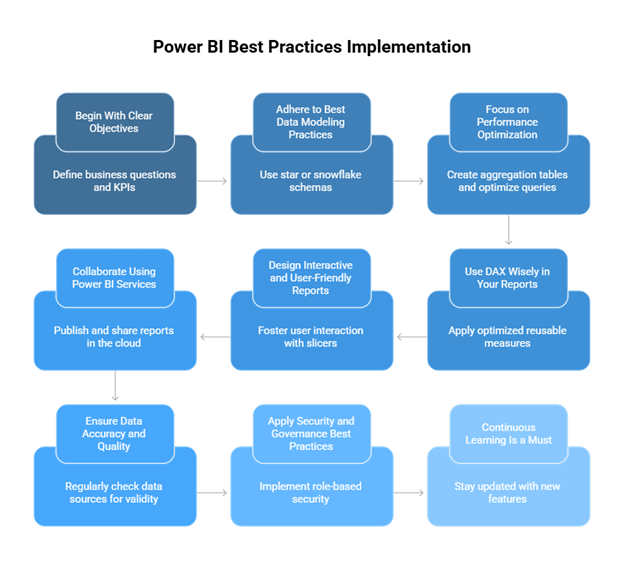
Begin With Clear Objectives
Specify clear objectives before development. Define the business questions you want to answer, examine the KPIs that need to be monitored, and identify the stakeholders from whom insights will be gathered.
Such clarity will ensure that the Power BI solution is kept in context for the business.
Adhere to Best Data Modeling Practices
A poorly designed data model will not be able to provide an efficient Power BI solution. Star or snowflake schemas should be enforced, relationships should be created logically, and unnecessary complexity should be avoided at all costs.
This will assist in increasing the solution performance, scalability, and maintenance.
Focus on Performance Optimization
Reports a slowdown in very large datasets and calculations. Create aggregation tables, reduce unnecessary visuals, and apply filters to variables that require it. Reduce the use of volatile measures and optimize data queries as well.
Use DAX Wisely in Your Reports
DAX stands for Data Analysis Expressions and is used for computations and business logic in Power BI. Wherever possible, restrict yourself to optimized reusable measures instead of calculated columns. Master navigation with the most critical DAX functions applied to filtering, time intelligence, and dynamic calculations.
Design Interactive and User-Friendly Reports
Foster user interaction with slicers, drill-through pages, and tooltips. Arrange visuals in a logical flow, apply consistent formatting, and avoid overwhelming layouts. Maintain simplicity so stakeholders can identify the information in a matter of seconds.
Collaborate Using Power BI Services
Publish, share, and manage your reports in the cloud using Power BI Services. Set up different workspaces for different teams, schedule data refreshes, and manage source versions so everybody uses the latest report version.
Ensure Data Accuracy and Quality
Regularly check your data sources for validity and apply the same transformations correctly. Checking your refresh logs will help you determine if there is any issue arising, so wrong insights do not make it to the decision-makers for consideration.
Apply Security and Governance Best Practices
Apply role-based security to make sure that only the people meant to see or edit the reports can do so. When handling classified information, enforce the use of sensitivity labels and ensure compliance with the data governance policies of your organization.
Continuous Learning Is a Must
Power BI keeps growing fast and being enhanced with newer features and updates. Hence, it is important to stay abreast of changes via Microsoft documentation, community forums, training sources, etc. Give the team members incentives to develop their skillsets for better returns on the platform.
Turn Business Data Into Decisions
How to Create Reports in Power BI?
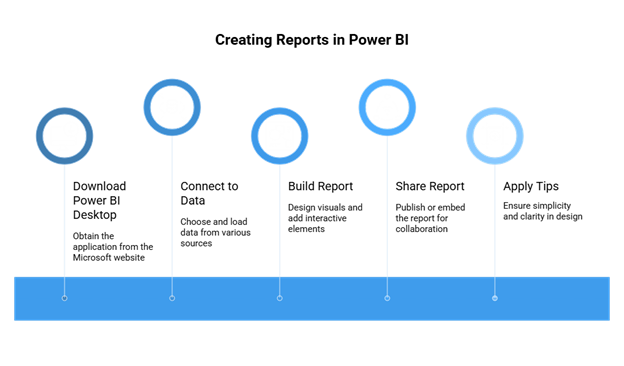
Building a report in Power BI involves connecting to your data, designing intuitive, interesting visualizations, and then sharing the findings with others. A methodical approach will keep your reports crisp and visually appealing, allowing your audience to draw insights quickly and effectively.
Getting Power BI Desktop
The first step is to download and install the free Power BI Desktop application at the Microsoft website. This desktop is a full-fledged application used for creating and designing reports. Upon installation, it offers a very intuitive interface to connect to data sources, model the data, and create interactive dashboards.
Connecting to Data
Once you have launched Power BI Desktop, select `Get Data` and choose the data source of your choice, such as Excel, SQL Server, or cloud services, then follow the prompts to connect and load your dataset into the workspace. Alternatively, you may paste data into a table, import data from a file, or retrieve it from a database. Making sure that your data is correct and complete at this point will set the precedent for the entire reporting procedure.
Report Building
The report canvas is where you create your visuals. The Visualization Pane offers various chart types, from bar charts to line charts and even pie charts. The Field Pane allows you to select fields from the data that you want to include in your visualizations. Drag these fields into visualizations of your choice and start coloring and formatting them. You can also place filters to limit the data shown and add slicers for an interactive experience that allows the end-user to control the view. A well-laid-out layout with a logical flow boosts clarity and engages the viewers.
Sharing and Collaboration
Once your report is finished, you can either save it on a local machine or publish it to Power BI Services (app.powerbi.com) for easy sharing and collaboration. You can grant access within the service to users or groups or embed the report into other applications like SharePoint or Microsoft Teams, allowing team members to view and interact with the report in real-time, forming quicker decision-making.
Tips for Effective Reports
Keep the design as simple as possible and never clutter the page with an overabundance of visual elements to create maximum impact. Use your report to build a story and guide readers through reported trends, exceptions, and KPIs in a logical flow. Consider your audience while designing charts and texts. Apply consistent formatting for clarity; above all, test your work and continue to iterate with user feedback.
Power BI Services and the Role of Power Platform Consulting Services
Power BI Services is an online business analytics platform by Microsoft. It empowers organizations to visualize, share, and collaborate on data insights in real-time. When combined with Power Platform consulting services, businesses work together toward accelerated adoption, implementation, and maximum value, achieved through expert advice, customization, and optimization for the long term.
Overview of Power BI Services
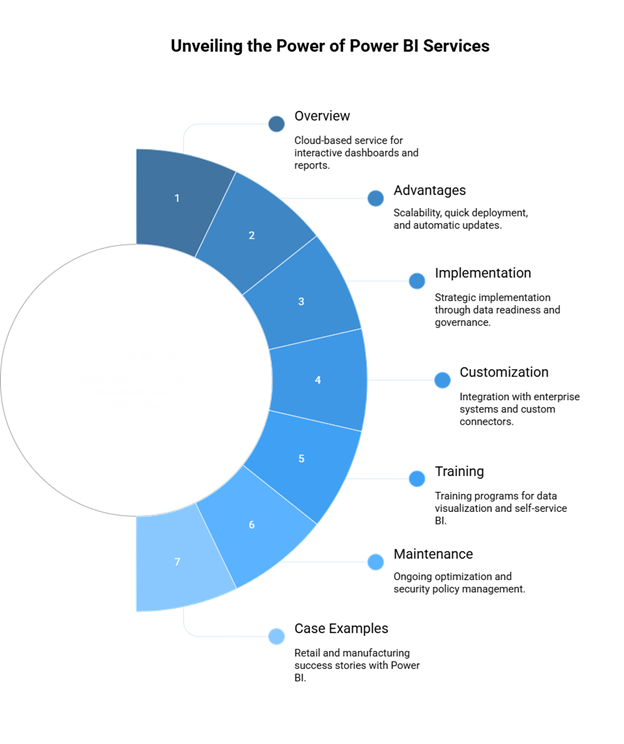
Power BI Services provides a fully managed cloud service environment for the creation, publication, and sharing of interactive dashboards and reports. There is no complicated server setup needed, with real-time collaboration capabilities to help everyone go along the road of data-driven decision-making. As Power BI seamlessly integrates into Microsoft 365 and Azure, workflow across business functions is fluid.
Advantages of Cloud-Based BI Compared to On-Prem Solutions
Cloud BI platforms like Power BI are a blaze with advantages, e.g., scalability, quick deployment, and automatic updates. Meanwhile, on-premises systems require investments in infrastructure, and their upgrades are manual tasks. Power BI thereby naturally scales up with the growing needs of a business. Users are offered an accessible reach-flux worldwide, acceptance of data in real time, and security of an enterprise-grade, all at no additional maintenance overhead.
The Role of Power Platform Consulting Services in Implementation
Consulting services create a bridge between technology and business outcomes to ensure the strategic implementation of Power BI. This means data readiness assessment, governance framework design, and configuring the service to suit the organization’s objectives. Their competency fast-tracks implementation and reduces the likelihood of risks concerning data quality, security, or problems with user adoption.
Customization and Integration with Enterprise Systems
Workflow varies from one organization to another. Power BI is therefore customizable against these workflows. Consulting services ensure integration of Power BI with ERP, CRM, HR, and financial systems so that business performance can be viewed as one. Custom data connectors are also built, row-level security is implemented, and departmental dashboards are created based on job roles.
User Training and Enablement Programs
Successful deployment of Power BI depends on adoption. The consultants typically run training programs for executives, analysts, and operational teams. Emphasis is placed on hands-on learning as well as best practices of data visualization and self-service BI. Empowering users means less reliance on IT teams in organizations and creates an environment that encourages data-driven decision-making.
Maintenance and Continuing Optimization
Besides deployment services, the Power BI consulting service aids the platform to keep up with ever-changing business needs, including performance monitoring, managing security policies, and data refresh scheduling. Also, consultants would assist businesses in staying ahead of the curve as new features come in with Microsoft updates.
Case Examples of Successful Deployments
Take the case of a retail chain that engaged a Power Platform consulting company to integrate Power BI with its sales, inventory, and customer feedback systems. Within weeks, the executive management was able to track real-time KPIs, which accelerated inventory turnover and led to the actual satisfaction of customers. Another manufacturing company worked with consultants to develop a predictive analytics dashboard and managed to reduce equipment downtime by 20%.
Is Microsoft Power BI the Best Reporting Tool for Your Business?
Choosing a solution in Analytics is never easy, given so many choices being presented. Microsoft Power BI is a powerful reporting tool that tries to balance some ease of use with enough flexibility and affordability. So, knowing what its strengths are as contrasted with some other platforms becomes essential to businesses in deciding whether the platform is right for them.
Advanced Reporting Nature
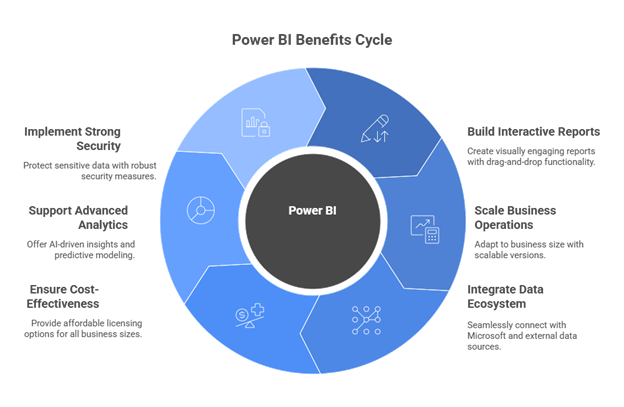
Currently, using Power BI, businesses can build highly interactive and visually engaging types of reports that are no longer just static charts showing trends. Users can spot trends, compare KPIs, or check performance metrics in real time. With a drag-and-drop approach, any user, sophisticated or not, can build dashboards worthy of a professional without ever writing lines of code. Actual insight is gained through data drill-down, which significantly speeds up decision-making processes.
Scaling at All Business Sizes
One of the advantages of Microsoft Power BI is its scalable nature. Small businesses might use the desktop version for free, whereas large corporations might go for Power BI Pro or Premium versions, which are rich in features. Because of its cloud-native nature, the organization can easily scale up in terms of various datasets and complex modeling without an upgrade in infrastructure costs. Instantaneous response and access are guaranteed, no matter whether you are working on a few hundred records or billions of data points.
Integration with Data Ecosystem
Fully integrated into the Microsoft ecosystem, Power BI naturally fits every organization already using Excel, Teams, Dynamics 365, or Azure services. This integrated connectivity guarantees a smooth flow of data inside systems and saves time, as well as elimination of work silos. Power BI can be connected to hundreds of external data sources, from SQL databases to cloud applications such as Salesforce and Google Analytics, thereby providing a 360-degree view of operations.
Cost-Effective Licensing
Microsoft Power BI is even competitively priced among other enterprise BI platforms. The free desktop edition contains great capabilities for single users and small teams, whereas the Pro and Premium editions provide additional features for a fraction of the cost of the competing alternative. This makes data access available to organizations without having to break their IT budget.
Advanced Analytics Support
Beyond basic reporting, Microsoft Power BI supports advanced analytics for organizations looking to get deeper insights. These AI features provide for predictive modeling, natural language queries, and anomaly detection. The DAX (Data Analysis Expressions) language works for custom calculations, covering the intricacies of analytical requirements. Thus, they give enterprises the ability to move past “what happened” to “why did it happen?” and “what is the likelihood of it happening next?”
Strong Security Features
Security is a pertinent issue for analytics adoption, and Power BI by Microsoft offers full enterprise protection. Whenever access is role-based, sensitive information gets viewed solely by authorized users. Data encryption happens both at rest as well as in transit through the network, and Power BI adheres to top global standards such as GDPR, ISO 27001, and HIPAA. Thus, these security measures make it a trusted pick if an organization is handling sensitive data.
Future Trends and the Growing Role of Microsoft Power BI
Business intelligence is going fast, and Microsoft Power BI is responding to that. It is a list of forthcoming AI innovations and industry-specific solutions that hold greater promise for those investing in this platform today. Knowing what is coming can help businesses plan ahead in strategic ways.
Further AI and Machine Learning Integration
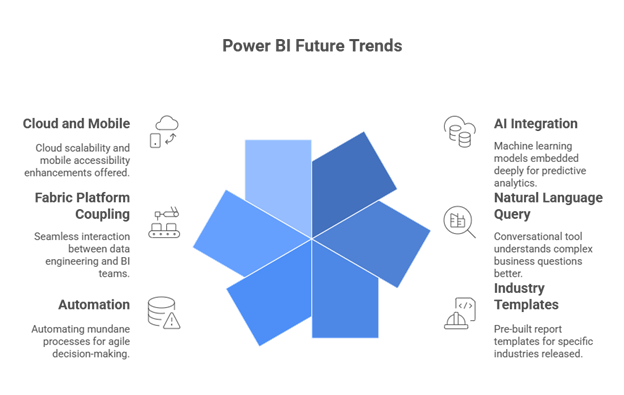
Future versions of Microsoft Power Business Intelligence will embed machine learning models deeply into its core operations, such that it will be possible to have some predictive and prescriptive analytics embedded in the dashboard,s causing industries to forecast outcomes, identify emerging trends, and obtain actionable recommendations without exporting data onto third-party tools.
Ability to Query using Natural Language
Up until now, the “Q&A” feature used to remain rather literal and straightforward, but capability advancements are transforming the feature into a more genuinely conversational tool that can truly understand complex business questions. It is only by improvements in natural language processing (NLP) that context, synonyms, and industry jargon can be better understood to allow non-technical users easier access to insights.
Industry Templates Are Expanded
It would also seem that Microsoft will start releasing more such pre-built report templates for specific industries. These templates proceed to help organizations from healthcare, finance, retail, and manufacturing deploy solutions offered by BI much faster, reducing development time while assuring compliance with industry standards and best practices.
Automation at Large
Before, the upcoming enhancements in Microsoft Power BI placed a lot of emphasis on undertaking mundane processes through automation. Businesses will now benefit from automated data refresh scheduling, AI-driven anomaly detection, and real-time alert systems since they can offer first-mover advantage by acting fast on opportunities or risks, thus becoming more agile in their decision-making.
Tighter Coupling with Microsoft Fabric Platform
As Microsoft Fabric matures and embraces Power BI, the latter will be one of the key pillars within this unified analytics ecosystem; consequently, it must provide seamless interaction between data engineering and BI teams, high performance, and workflows that flow seamlessly across the Microsoft data stack.
Cloud-First and Mobile-First Enhancements
Cloud scalability and mobile accessibility will be at the forefront of the next generation of changes. Microsoft Power BI shall be offering management of gigantic datasets in the cloud, coupled with a richer mobile experience for decision makers on the move who require data insights.
Conclusion
The Power BI by Microsoft has established itself as one of the premier business intelligence and data visualization platforms that allow enterprises to transform raw data into decisions. From data connectivity, data modeling, and AI-based analytics to interactive dashboards, these features, in essence, empower business users alongside data professionals. Given the tight integration with the Microsoft ecosystem, this platform supports collaboration, scaling, and anticipatory decision-making across industries. As businesses continue to be led by data, it becomes imperative that companies invest in Microsoft Power BI to stay competitive, agile, and driven by insight. With the proper exploitation of its capabilities, businesses can go on to gain insights faster, respond more quickly, and maintain growth in a more data-driven world.
If you are looking for Power Platform Consulting Services, you can visit us here.
Frequently Asked Questions
Q1. Is Microsoft Power BI free?
Yes, Microsoft Power BI does have a free tier. Power BI Desktop is a free download. Besides, Power BI can be used for free within Microsoft Fabric: You can create and share reports, explore data, and collaborate on projects.
Q2. What is Microsoft Power BI used for?
Power BI, the business analytics platform from Microsoft, allows you to turn data into information with actionable insights. Be it a user, a report creator, or a developer, Power BI offers integrated tools and services that connect, visualize, and share data across the organization to which they belong.
Q3. Does Microsoft Power BI require coding?
Power BI can be used without writing any code, when it comes to simple tasks and report building with its drag-and-drop interface. DAX and Power Query M, however, are formula languages applied to heavy data transformation, calculation, and visualization. So they are not strictly required for Power BI, but if you learn these languages, Power BI is much more capable and powerful.
Q4. Is Power BI an AI tool?
Power BI is not only an AI tool, but it also uses a considerable amount of AI to improve its capabilities as a business intelligence (BI) platform. It uses artificial intelligence to automate tasks, generate insight, and provide advanced capabilities for data analysis, therefore rendering them easier. In short, Power BI is doing its BI via AI.
Recent Posts
- When Should Businesses Bring in Azure Cloud Experts for Their Projects?
- Azure Cost Optimization: How Businesses Reduce Cloud Spend After Migration
- How Expert Cloud Consultants Manage Risk in Large-Scale Cloud Initiatives?
- Why You Need to Hire an Azure Cloud Engineer in 2026?
- When Should Businesses Hire DevOps Engineers for Cloud-Scale Delivery?


