Monitoring Application Health using Application Insights

As Peter Drucker famously said “What Gets Measured Gets Improved” applies to this day. The people that understand how analysis of a business can make or break it, value accurate and timely analytics associated with it at every phase of business development. This principle of business development also applies to software development as eventually a software is targeted to enable businesses.
The way we have regular health checkups to avoid any unpleasantries and even more in case of severe illness, applications also can be monitored for health.
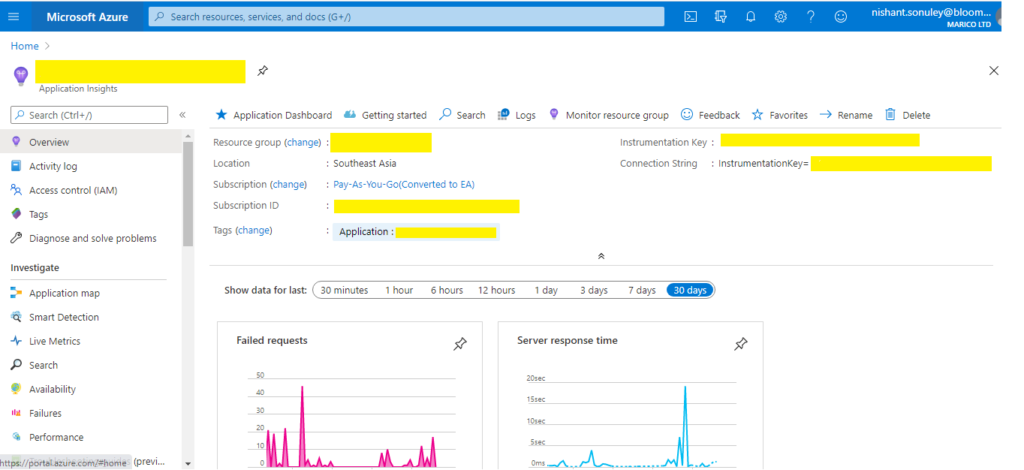
Microsoft Azure’s Application Insights help exceedingly well to consistently measure application health and observing patterns in application behavior. These Application Insights need to be logically coupled with app service in order to let application insight recognize which app service it needs to monitor. This is done using Instrumentation Key made available once application insight is created. A good idea is to keep app service and application insight in the same resource group with a common application tag.

What can Application Insights monitor?
Application Insight Search is one of the most used services by developers and Dev Ops to observe and find any irregularities in application behavior. This service is used to monitor all major application health parameters like traces (which are logs that can be added from application code), requests (made to the app service), page view (giving precise information on-page processing), custom events, exception (to pinpoint what caused a failure/bug in-app service), dependency (lists dependent API/DB calls of a request in concern) and availability (used to check if the app is running and responding from any given user endpoint and also alerts in case response is too slow or unacceptable). We will be discussing these in brief ahead.
Following screenshot shows mentioned filters used in an Application Insight Search:

To simplify, teams use Application Insight Search to check app performance and how app is treating users. It basically monitors:
- Request/response time and failure rates – This allows development teams to analyze and find patterns in the app. Further allowing to find out pages which are frequently accessed, time at which pages are accessed, from where (includes a region with state and country) the pages are accessed.
- Use: All these parameters help development teams find out what resources can be static and how response time can be reduced. If there are any failures, this also helps development teams finding the root cause of the issue and planning a most suited solution.
- Dependency rates – This allows teams to analyze and monitor what resources are dependent on other resources. This eventually helps in monitoring which resources are slowing down the app performance.
- Use: Usually this helps in tracing any dependent calls to external entities (API/DB calls) that are outside of app service.
- Diagnostic traces – These are app logs saved as traces to monitor if app events are working as planned.
- Use: Traces can be heavily used if we need to monitor app behavior. This can work as a debugging tool on cloud-deployed code. For example, if an app is trying to connect with an email server, IPs that need to be whitelisted can be traced using this diagnostic.
- Exceptions – This is highly useful in identifying if there is an exception while responding to a request. This also includes exceptions outside of app service given app service logs these exceptions.
- Use: This maintains historical data of exceptions to further identify patterns in exceptions.
- Analysis of CPU, memory, and network – This enables teams to find out are hardware resources allocated for an app really optimized and used efficiently.
- Use: This helps in deciding whether a consumption plan needs to be modified.
- Custom events – This is a more refined version of traces. Here development teams can have customized events logged to track and meet business requirements using telemetry.
- Use: Allows registering customized events from device and desktop apps, web clients, and web servers.
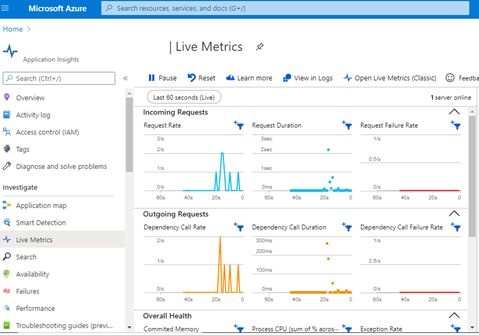
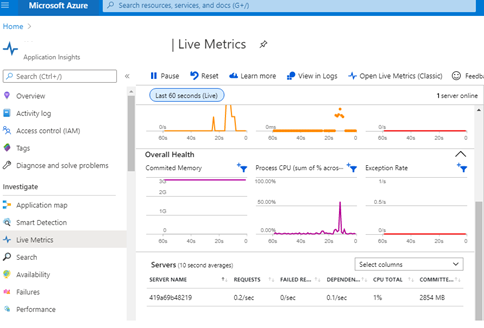
Apart from Search, Live Metrics are tremendously useful in analyzing live requests and performance in seconds. This can give real-time analytics of apps which is critical in many business requirements.
To understand its use, let us consider the following events:
- A user logs in
- Attempts a payment transaction from a gateway
- But session expires
Using Live Metrics, we can not only see the flow of events (using traces), but can also monitor real-time cause of the timeout. In the above events, we can tag each trace to mark it as a grouped event and monitor failure in seconds. This enables monitoring incoming and outgoing requests along with how the CPU was used to complete the transaction.


Availability of web app
Using Availability service, a development team can create tests to monitor availability and responsiveness. Application Insights can send web requests to the deployed web app at regular intervals from around the world and find out delays in response. It can also alert concerned stake owners if the app is not responding from any area or even if the response is not as fast as expected.
Following are three types of availability tests:
- URL ping test: This test is simple and basically checks if the web app endpoint is responding. It also allows checking response performance and retries to repeat the test.
- Multi-step web test: Basically a set of recorded sequences made of web requests of a web app under monitoring, which can be played back to test availability. Microsoft no longer recommends using the multi-step recorder as it was targeted towards static HTML pages but allows creating multi-step web tests which include tests from assigned locations for allocated frequency.
- Custom Track Availability Tests: This allows us to create and run custom availability tests, using TrackAvailability() method of TelemetryClient and can send the test results to Application Insights for analysis.
DevOps can also set up availability tests for an endpoint that is accessible from the public IP address. The idea behind these tests can be as simple as to test the availability of an API that app service depends on and monitor the response from this API. The limit for creating availability tests per Application Insights resource is 100.


